
Co-Founder and CEO of iKnowlogy Ltd. - Data science and BI professional services.
One of the first BI use cases that growing online companies need is a data solution for marketing activities.
Using Google Analytics or any other external analytic platform will only get you a certain distance, but once you have multiple marketing platforms things start to get messy. That is when online marketing experts start thinking…
“I wish I could just see all of my campaigns and their outcomes in one place instead of logging into different systems or consolidating Excel reports.”
Solving this is a 4-step process:
1. You need a DWH.
2. Load the relevant data sources to your DWH.
3. Process the data sources into a BI data model.
4. Connect a BI tool to the data model and create your dashboards.
And one more thing before we get started — creating this marketing BI model is the first step to developing any other advanced analytic or data science solution such as: an alerts system, automatic optimization, or LTV prediction.
Step 1 - A DWH
If your company already has one, great.
If not and you are reading this blog article, you probably need one.
DWH’s used to be complicated and expensive, but nowadays they are not.
We almost always recommend Snowflake. Will write more about this in a different article.
Step 2 - The Data Sources
Loading data to a DWH is referred to as an ETL process (extract, transform, load). In more modern architecture it is ELT…
Anyway, this would be a subject of a different blog post.
For our purpose let’s just say that the data sources that are relevant to the task at hand are:
- Marketing performance data — Daily stats of impressions, clicks, reach and cost at the lowest granularity that you can get (date | ad_id | platform | placement | etc…)
- Marketing platforms metadata — Metadata on the configuration of your campaigns: campaigns status, names, links.
- Conversions data — This would be the first touch point you that you have with the customer. It is what you want to happen when a visitor clicks the ad. For example, this could be your user registrations or app installs. In case of retargeting campaigns, it is the return event of the user. For ecommerce it might be the first purchase.
- Attribution — You must be able to link each conversion event (item #3 above) to the campaign from which it came. In some cases, it can be very simple to attribute your conversions or users to campaigns, but sometimes it is complicated. But this is the subject of a different blog post anyway.
- Revenue or post-conversion events (events table) — It is not enough to just say how many registered users or sales you got from a campaign. You would want to also calculate %ROAS or LTV/CAC. For this you will also need data on what the user did.
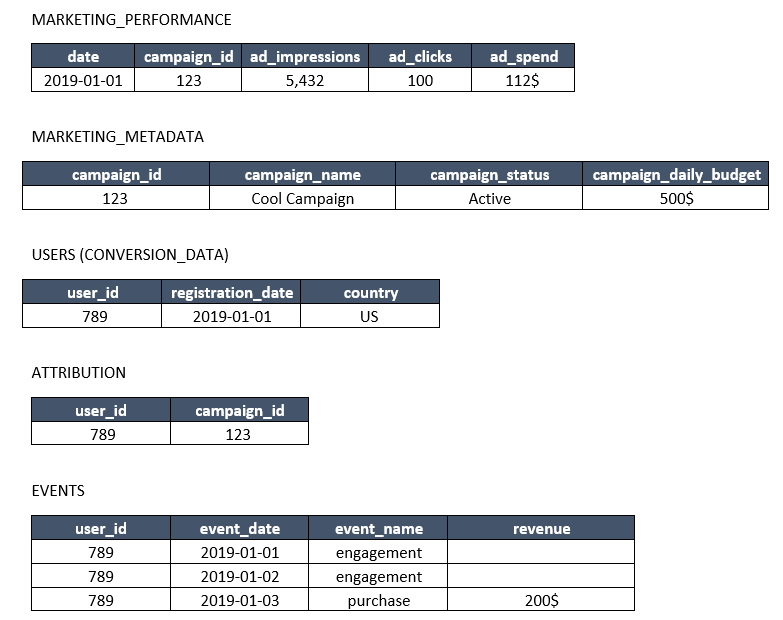
Let’s consider some sample tables that would help us to understand the data. I will use these tables in the next section to see how they are processed. Of course, you might have your raw data in a different structure compared to what I have here. Also, usually there are many more dimensions to the data.
The use-case depicted in these tables is of an online platform that want to drive more user registrations. The users can later make purchases that generate revenue. This model fits many SaaS, gaming, or eCommerce businesses.
Please take a minute to understand the data sources.
Step 3 - Processing Your Data
Your raw data sources might be in different structures depending on where and how you loaded them to your DWH. So the next step would be to do some processing using SQL.
I developed the following methodology that proved itself many times.
You will notice that the resulting table will have 2 layers. I refer to them as:
1. The REVENUE Layer that holds information from user registration downstream in the user lifetime.
2. The SPEND layer that holds the marketing spend.
The last step after creation of the layers will be to create a table with a UNION between the layers
Create the Revenue Layer
The revenue layer is just an enriched users table. It holds all information relevant to the registered user from the marketing channel down to its purchases.
Create a table that has 1 line per user and that has all user attributes.
Go over the SQL below and make sure that you understand the structure. Notice that the “user_activity” section is where you can add as many metrics as you want.
Checkout how Revenue is calculated both as the cumulative life-time (LT) value and the revenue until day 7 since the user registered.
create table REVENUE_LAYER as
with enriched_events as
	(SELECT a.*,
	       a.event_date - b.registration_date as activity_day
	from EVENTS a
	  inner join USERS b on a.user_id=b.user_id
	),

user_activity as
	(select a.user_id,
		sum(a.revenue) as revenue_lt,
		sum(case when activity_day<7 then a.revenue else 0 end) as revenue_d7,
		max(case when activity_day=7 and a.event_name='engagement' then 1 else 0 end) retention_d7
	from enriched_events a
	group by 1)

SELECT
	a.user_id,
	a.registration_date,
	a.country,
	b.campaign_id,
	c.revenue_lt,
	c.revenue_d7,
	c.retention_d7,
	d.campaign_name,
	d.campaign_status,
	d.campaign_daily_budget
from USERS a
  left join ATTRIBUTION b on a.user_id=b.user_id
  left join user_activity c on a.user_id=c.user_id
  left join MARKETING_METADATA d on b.campaign_id=d.campaign_id;
Create the Spend Layer
The spend layer will contain the data on the activity in your marketing platform.
create table SPEND_LAYER as
select
  a.date,
  a.campaign_id,
  a.ad_impressions,
  a.ad_clicks,
  a.ad_spend,
  b.campaign_name,
  b.campaign_status,
  b.campaign_daily_budget
from MARKETING_PERFORMANCE a
left join MARKETING_METADATA b
  on a.campaign_id=b.campaign_id;
Unite the Layers
We will now unite the layers and match between dimensions from each table. Not all dimensions have to match, and the metrics can’t match at all. We’ll see the special effect of this layer structure in the next step.
In this step we can also aggregate the data.
create table MARKETING_MODEL as
select
  registration_date as date,
  country,
  campaign_id,
  campaign_name,
  campaign_status,
  campaign_daily_budget,
  sum(revenue_lt) as revenue_lt,
  sum(revenue_d7) as revenue_d7,
  sum(retention_d7) as retention_d7,
  null as ad_impressions,
  null as ad_clicks,
  null as ad_spend,
from revenue_layer
group by 1,2,3,4,5,6

UNION ALL

select
  date,
  null as country,
  campaign_id,
  campaign_name,
  campaign_status,
  campaign_daily_budget,
  null as revenue_lt,
  null as revenue_d7,
  null as retention_d7,
  ad_impressions,
  ad_clicks,
  ad_spend
from spend_layer;
Step 4 - Accessing the Data
Our model is now ready for analysis. This can be done by way of ad-hoc querying, or you can connect a BI tool and expose reports and dashboards to non-technical users.
I would like to point out just a couple of specific points regarding the structure of the data:
1. Metrics
In the processing step above we only created metrics that are either counts or sums.
Ratio metrics such as CTR, CR, ROAD, % retention should be implemented in the visualization layer. This way the calculation will be correct no matter what level of drill down you do in the analysis.
2. Dimensions
Notice that some dimensions are shared between layers. For example, date, campaign_id and campaign_name. Other dimensions are not shared, “country” for example. The reason that country is present in the Spend layer is that we didn’t receive this breakdown in the MARKETING_PERFORMANCE data source of the example.
This means that trying to breakdown and analyze the data per country will split the revenue, but will not split the spend. The country of spend will always appear as Null.
Here is a sample query on the example tables that will show %7day ROAS per date and campaign:
select
  date,
  campaign_name,
  sum(revenue_d7) / sum(spend) as roas_7d
from MARKETING_MODEL
group by 1,2;